Get 60 days of Loading Reports
Advanced and Premium plans come with 60 days of Loading Reports, allowing you to view an integration’s loading behavior over time, identify high volume tables, and quickly resolve errors if they arise.
For more info about Stitch Advanced, contact the Stitch Sales team.
Loading report availability
Loading reports are available only for integrations powered by Singer taps. As integrations are converted to the Singer system, loading reports will be made available.
The last phase of every Stitch replication job is called Loading. During Loading, Stitch loads extracted data into your destination. The Loads tab - accessed by clicking into the integration from the Stitch Dashboard - provides detail about the loading portion of the replication process for a given integration.
In this guide, we’ll cover:
Report retention
Loading reports are grouped by day. The number of days’ worth of reports available to you depends on your Stitch plan:
-
Free trial: 7 days
-
Standard: 7 days
-
Advanced: 60 days
-
Premium: 60 days
Reports and plan changes
Changing your plan can impact reports currently available to you.
Plan downgrades
If you downgrade to a plan that offers fewer days’ reports, you’ll lose access to the difference between your current plan and your new plan.
For example: If you downgrade to Standard from the Advanced plan, you’ll lose access to 53 days’ worth of reports.
Plan upgrades
Likewise, if you upgrade to a plan that offers more days’ reports, you’ll immediately gain access to the difference.
For example: If you upgrade to Advanced from the Standard plan, you’ll gain access to an additional 53 days’ worth of reports.
Loading Report composition
When the Loading Reports tab is first clicked, the loading reports for all tables will display first.
Every row on this page corresponds to a single table that is set to replicate. The data in each table’s row is updated upon every successful load to your destination, thus reflecting the loading state for the tables overall:

Clicking the name of the table in the Tables to Replicate column will open a page with a loading report for that table, enabling you to see loading behavior for the table over time.
Loading data by time range
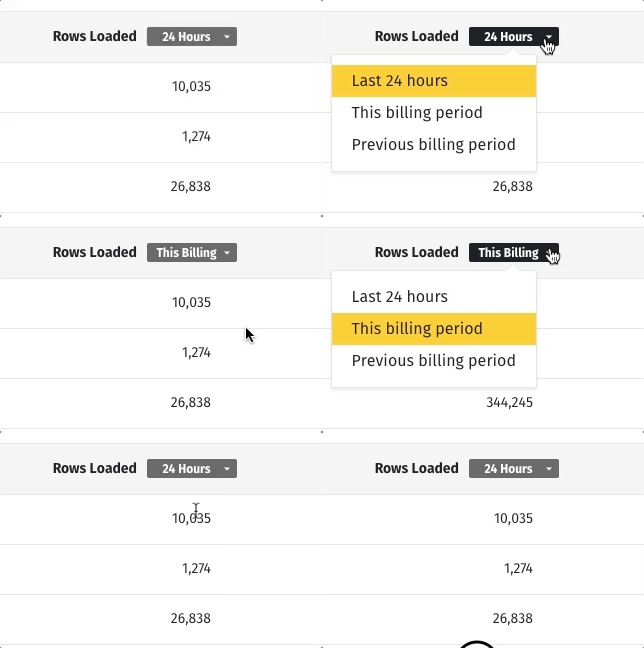
Use the toggle next to Rows Loaded to view a table’s loading data based on the time range you select:
- 24 hours: Loading data for the past 24 hours
- This Billing: Loading data for the current billing period
- Prev Billing: Loading data for the previous billing period
Note: A billing period is 30 days. To view the day the current billing period will end, navigate to the Billing page (User menu (your icon) > Billing) and locate the Next billing date field.
Loading data for subtables
Depending on the structure of your data in the source and the destination you’re using, subtables may be created from a parent table.
If a table contains subtables, a Plus icon icon will display next to its Rows Loaded value. Click the icon to view the number of rows loaded for its subtables.
You can read more about subtables in the Nested Data and Row Counts guide.
Loading data for non-replicating tables

Loading data for tables not currently set to replicate may be available if the time of the last load is within the selected time range.
For example: If the last load occurred less than 24 hours ago, the table’s loading data will display when 24 hours is selected. If it occurred more than 24 hours ago, select This Billing to see this table’s loading stats for the current billing period.
Loading Reports by table
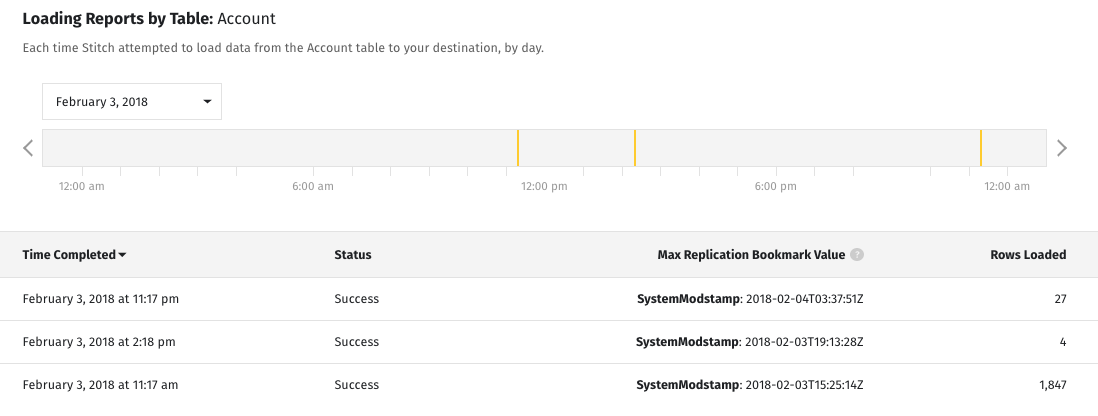
The Loading Reports by Table page contains detailed loading stats for the selected table, broken down by day. The graph at the top of the page displays every time Stitch attempted to load data for the table into your destination for the selected date.
To view loading reports for a specific day, use the date picker located above the graph. Note: The number of days’ worth of logs varies by plan type.

In addition to displaying the time a load began, the tooltips also include how long the loading job ran and if any errors arose during the job.
Replication bookmarks in Loading Reports
Integration loading reports can contain information about the recency of your data. The Max Replication Bookmark Value column contains the highest or most recent Replication Bookmark Key value Stitch has loaded into your destination for a given table or replication job, displayed as column_name: value.
Using the values in this column, you can identify how up-to-date the data in your destination is on a table-by-table basis or check the progress of a historical replication job.
Keep in mind that:
- Replication Bookmark Key columns may not always be timestamps. Some may be integers, like
id: 1234. - For SaaS integrations, Stitch automatically selects the Replication Bookmark Key column. Refer to the integration’s schema documentation for the column(s) Stitch uses for each table.
- For Database integrations, this is a column selected by you during Replication Method setup
- If the table is currently being loaded (indicated by a
 icon), some data may load out of order. We suggest waiting until the load is complete to check the completeness of the data.
Replication Bookmark values, by page
On the Loading Reports for All Tables page, the value in this column will reflect the highest or most recent value for the table overall:

On the Loading Reports by Table page, the value in this column will reflect the highest or most recent value for each replication job for the given table:

Replication Bookmark unavailable
For some tables, a Bookmark Unavailable message may display in the Max Replication Bookmark Value column in place of a value:

There are a few reasons this message may appear:
- The table uses Full Table Replication or Log-based Incremental Replication, replication methods which doesn’t use a Replication Bookmark Key,
- The column designated as the Replication Bookmark Key contains
NULLvalues, or - The integration doesn’t support this feature. As this functionality is added to eligible integrations, Replication Bookmark Key values in loading reports will become available.
Loading errors
If an error occurs during the loading process, a icon will display to the left of the affect table(s). To view the error for the table, hover over the error icon and then click the link in the tooltip.
This will bring you to the Loading Report page for that table, where the error message will be expanded:

If an error arises, check out the Destination Loading Error Reference for help.
| Related | Troubleshooting |
Questions? Feedback?
Did this article help? If you have questions or feedback, feel free to submit a pull request with your suggestions, open an issue on GitHub, or reach out to us.