Skip Navigation
How do you begin combining data from SaaS applications with your internal databases to gain insight into your business? Maybe your organization has already standardized on Amazon QuickSight as your analytics tool, but you're still learning about using it with multiple data sources. In this tutorial, we’ll show you how QuickSight can help you deliver business insights.
To analyze data from diverse sources, you need a data warehouse that consolidates all of your data in a single location. Most businesses take advantage of cloud data warehouses such as Amazon Redshift or Snowflake.
You can extract data that you have stored in SaaS applications and databases and load it into the data warehouse using an ETL (extract, transform, load) tool. Stitch is a simple, powerful ETL service for businesses of all sizes, up to and including the enterprise. It can move data from dozens of data sources to several different data warehouses. If your organization already uses a data warehouse, you can sign up for Stitch and be moving data to your destination in five minutes. Choose at least one of Stitch's integrations as a data source. Most businesses get more value out of their data as they integrate more data sources; for our example, we'll look at data from two separate SaaS applications.
Once you have data in your data warehouse you can use QuickSight for business intelligence (BI). It can connect with more than two dozen data sources, including data warehouses like Amazon Redshift and Snowflake; databases like MySQL, PostgreSQL, and Microsoft SQL Server; and AWS services like Aurora, Athena, and S3.
Setting up a data warehouse
I used some of Stitch’s real data to build a data visualization for this post. Specifically, I was curious to see how many support conversations came from each of our pricing tiers. To find out, I needed to use billing data stored in Salesforce and join it with support conversation data from Intercom to create a visualization.
The first step was to choose or set up a data warehouse to hold the data I'd be replicating from Salesforce and Intercom. If you don't already have a data warehouse, choose one that meets your needs. I picked Panoply, a platform that provides a managed version of Redshift. If you choose Redshift, Snowflake, or one of the other destinations Stitch supports, you can follow the setup steps in the Stitch documentation.
Setting up Stitch for ETL
The next step is setting up an ETL pipeline to replicate data from your sources to the data warehouse. Stitch makes extracting data from a source and loading it into a data warehouse easy. To get started, visit the signup page and enter your email address, and on the next page enter your name, your company's name, and a password.
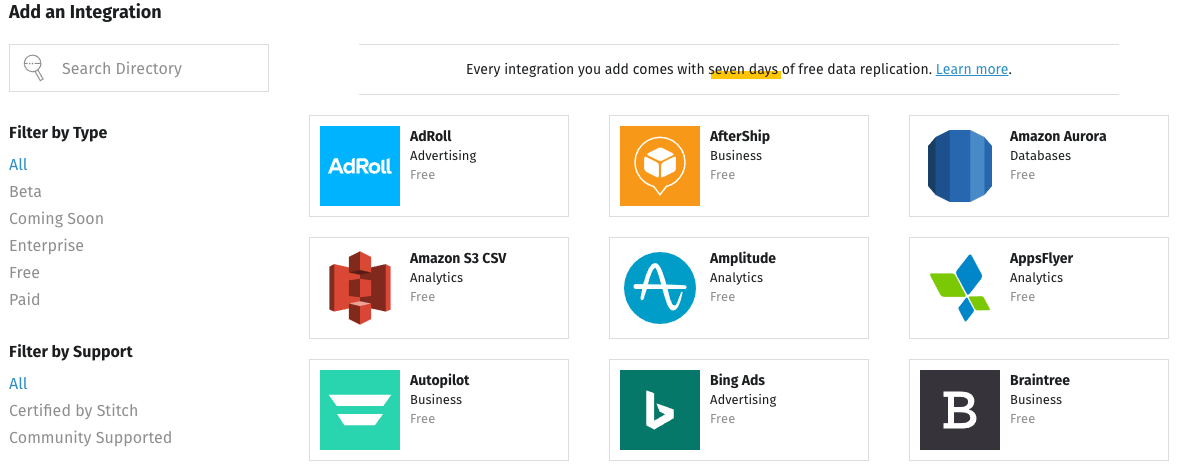
I added Salesforce and Intercom:
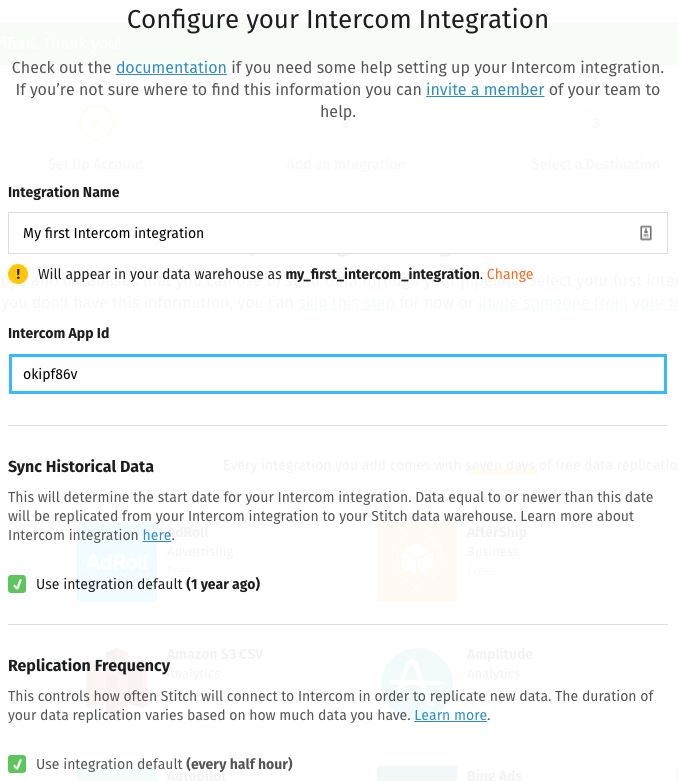
The documentation linked at the top of the Configure Integration page walks users through the process, which is slightly different for every data source. Depending on the integrations you set up, Stitch may ask you to choose the tables whose data you want to replicate and the fields within those tables.
Add a destination
Once you've selected all the integrations, tables, and fields you want, it's time to select a destination:
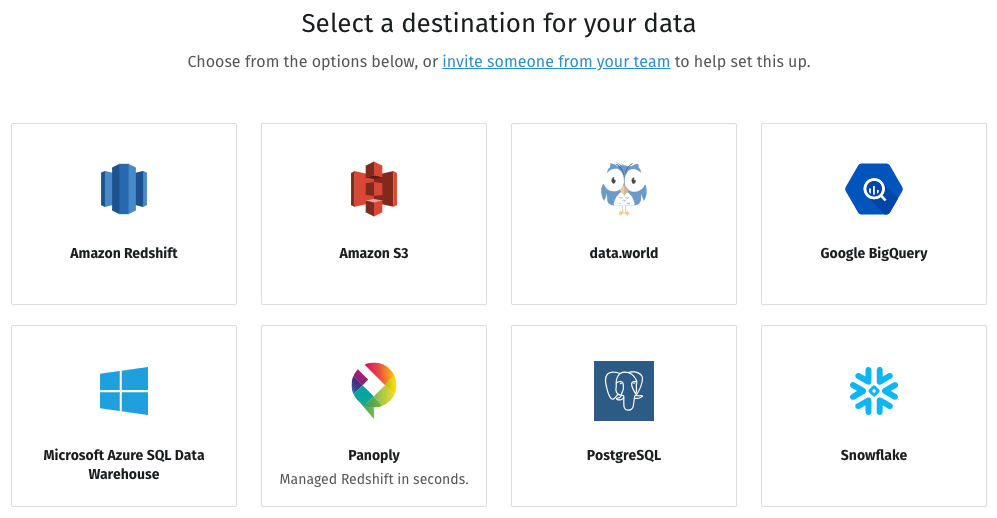
If you don't already have a data warehouse, you can set up a Panoply destination easily from within Stitch. At the Select a Destination screen, click on Panoply, click on Create a New Account, and follow the prompts. Stitch will use the email address you logged in with, autogenerate a secure password, and set up a database destination. Save your login credentials so you can access your new data warehouse in the future.
Clicking on the Panoply icon brings you to a screen where you can enter your credentials:
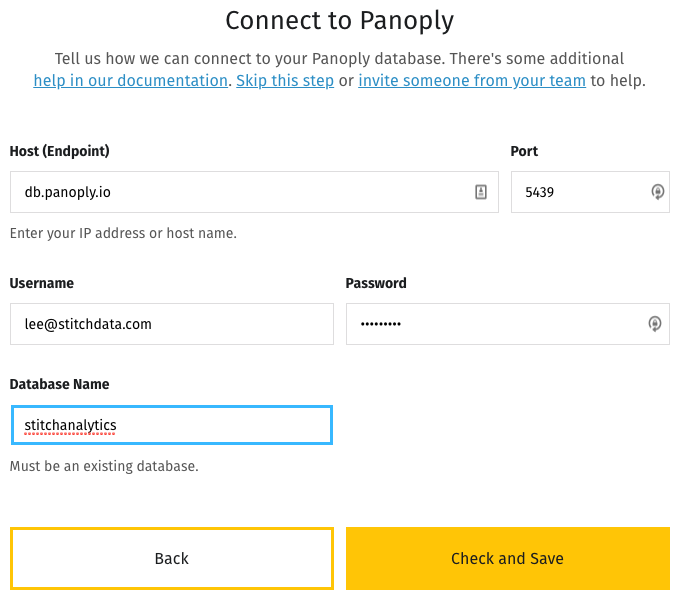
Fill in your data and save the screen, and you'll have all the pieces in place and the data ready to flow.

When you visit your Stitch dashboard, you'll see that your integration is marked Pending. It takes a little time for Stitch to queue up your replication. If you refresh the screen, you'll see the status change to In Progress.
From the dashboard you can also do things like change the replication frequency and add fields, tables, and integrations.
Connecting to your data warehouse from QuickSight
Once the pipeline is pushing data to your destination you can connect QuickSight to your data warehouse. Log in to QuickSight. If your data is in an RDS instance or Redshift cluster, choose it here.
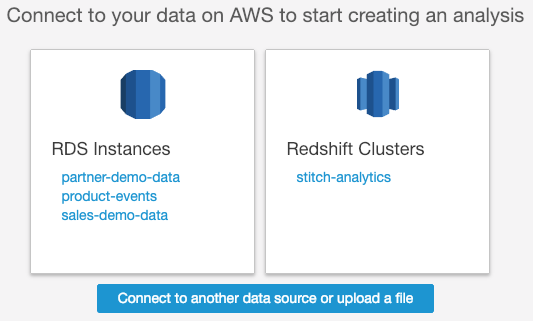
Mine wasn't listed, so I clicked Connect to another data source or upload a file, chose Redshift, and entered my Panoply credentials.
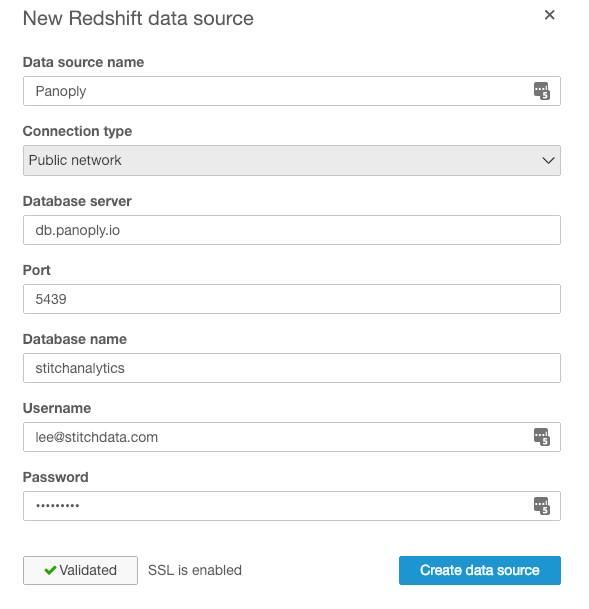
Next, choose the schema you want to work with, and a table within that schema, then click Select. To finish creating your data set, you can choose to import the data to SPICE, QuickSight's in-memory optimized calculation engine, for better performance, or directly query the data. Click Visualize to complete the process.
To add additional tables to be used in a visualization, go to the main QuickSight page and click on New data set. Scroll down to From Existing Data Sources, pick your database, click Create data set, and select the next schema and table you want to work with, then click Select, or you can click Edit/Preview data, which brings up a screen that lets you deselect fields you don't want to work with, add calculated fields, and change field data types.
To join tables for more complex visualizations, you can click on Add data at the top of the data preparation page and use QuickSight's GUI. However, if you're familiar with SQL, you may find the process of visually joining tables cumbersome. Fortunately, QuickSight provides a better alternative. From the main QuickSight screen, click New analysis, then New data set. Choose your data source, then click Create data set. This time, instead of picking a schema and table, click Use custom SQL. Choose a name for your query, then paste in the SQL code you want to use and click Confirm query.
I spent some time in a SQL editor building a query to give me exactly the data I wanted. My query brought together columns from multiple tables in two schemas. The SQL code (shown below) excludes prospects by retrieving only companies for which we have account IDs, and selects current customers by excluding companies that are marked as deleted. It also consolidates clients on annual and monthly billing programs in each of our plans into a single number for each tier:
-- join users to companies
    intercomid AS (
    SELECT
    users.id AS userid,
    ucc.id AS companyid
    FROM intercom01.users AS users
    JOIN intercom01.users\__companies__companies AS ucc
    ON ucc._sdc_source_key_id = users.id),

    -- match Intercom ID with Stitch ID
    userco AS (
    SELECT
  DISTINCT intercomid.userid,
  intercomid.companyid,
  company_id AS stitch_id
     FROM intercom01.users\__companies__companies AS companies
     JOIN intercomid
       ON companies.id = intercomid.companyid),

   -- get number of conversations
     convs AS (
     SELECT
       conversations.id AS convo_userid,
      count(conversations.id) AS convo_count
    FROM intercom01.conversations__customers AS conversations
    WHERE conversations.type = 'user'
    GROUP BY conversations.id),

  -- join user/companies to conversations
    usercoconv AS (
    SELECT
      userco.userid AS userid,
      userco.companyid AS companyid,
      userco.stitch_id AS stitchid,
      convo_userid,
      convo_count
    FROM convs
    JOIN userco
      ON convs.convo_userid = userco.userid
    GROUP BY userco.userid, userco.companyid, userco.stitch_id, convs.convo_userid, convs.convo_count),

  -- salesforce data
    sf AS (
    SELECT
      CAST(cid__c AS TEXT) AS stitchid,
      case
        when tier__c LIKE '%Starter%' then 'Starter'
        when tier__c LIKE '%Basic%' then 'Basic'
        when tier__c LIKE '%Premier%' then 'Premier'
        when tier__c LIKE '%Custom%' then 'Enterprise'
        else tier__c
        end as tier
    FROM salesforce01.account AS account
    WHERE
      account.isdeleted IS FALSE
      AND tier__c IS NOT NULL
      AND tier__c != 'Free Trial')

  -- join user/company/conversations to sf
  SELECT
    usercoconv.convo_count,
    usercoconv.userid,
    usercoconv.companyid,
    usercoconv.stitchid,
    sf.tier
  FROM usercoconv
  JOIN sf
    ON sf.stitchid = usercoconv.stitchid
  GROUP BY tier, usercoconv.convo_userid, usercoconv.userid, usercoconv.companyid, usercoconv.stitchid, usercoconv.convo_count
  ORDER BY convo_count;
  QuickSight returned a data set with the fields I asked for.
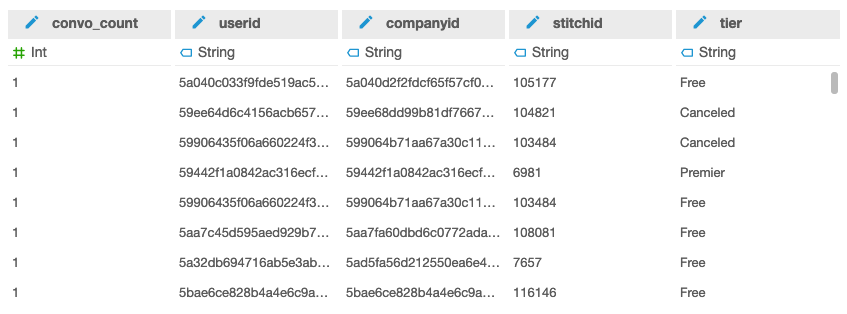
Now the trick was to create a visualization. I clicked Save & visualize, then selected vertical bar chart from the available visual types. I dragged the tier field to the X axis, and the count of conversations to the Value field, and QuickSight gave me the visualization I wanted.
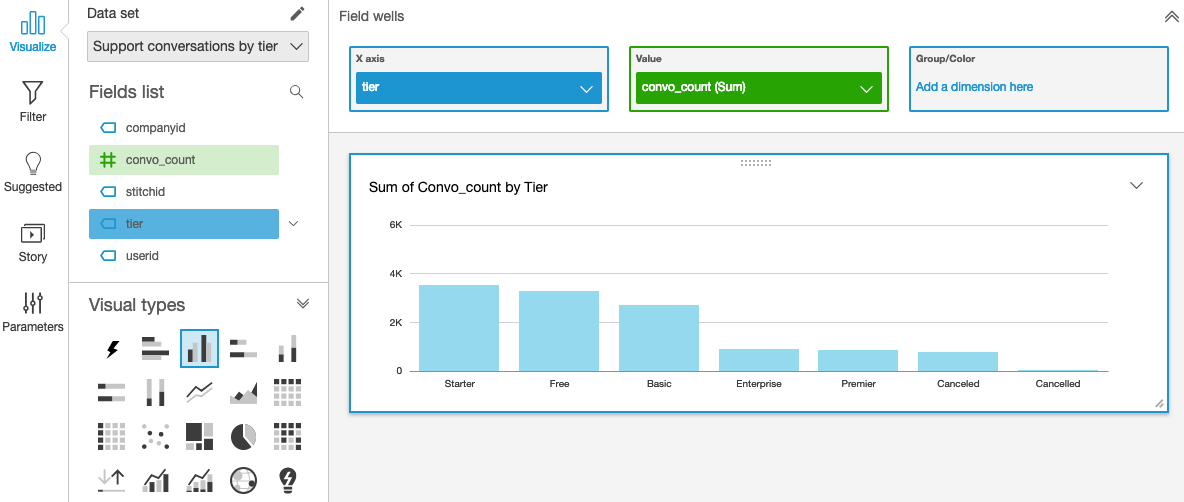
Using an ETL tool like Stitch to move data into a data warehouse lets you leverage the power of Amazon QuickSight to correlate and report on data from multiple sources. Sign up for a free trial of Stitch and start creating your own.
Give Stitch a try, on us
Stitch streams all of your data directly to your analytics warehouse.
Set up in minutesUnlimited data volume during trial